8 min read
Materials for aerospace components: a guide to making the right choice
Choosing the most suitable material for an aerospace component is one of the most delicate design decisions. Every gram affects fuel consumption,...
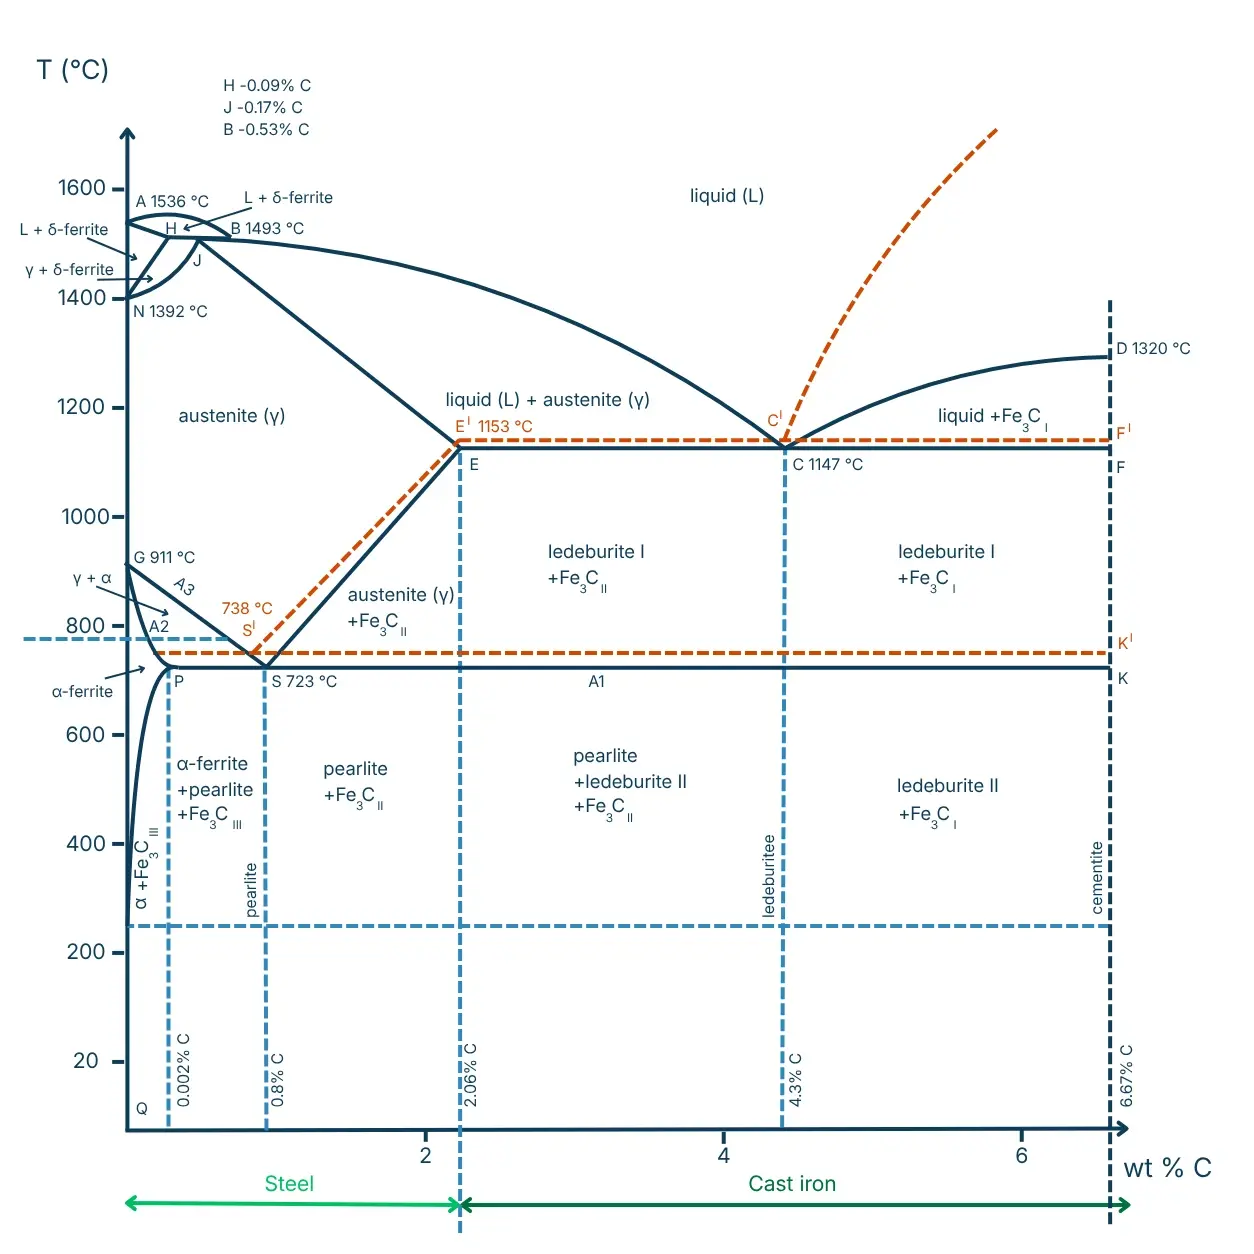
The iron-carbon diagram is one of the most important tools in metallurgy and metallic materials design. It is used to understand how steels and cast irons behave as a function of temperature and carbon content.
Understanding the iron-carbon diagram is essential for choosing the correct material, designing heat treatments, predicting mechanical properties, and checking hardness, strength and ductility.
It is the theoretical basis for much of the modern steel industry.
The iron-carbon diagram is an equilibrium diagram that describes the structural transformations of iron-carbon alloys as a function of temperature and carbon content.
It shows which metallurgical phases form during heating or cooling, thereby making it possible to predict the final microstructure of the material.
Carbon is the element that most influences the behaviour of steel.
Small variations in carbon content modify: hardness, mechanical strength, toughness, weldability, and ductility.
In general:
The diagram relates the carbon percentage from 0% to 6.67% (horizontal axis) to the temperature up to 1,600 °C (vertical axis).
Within the diagram, various phases, critical lines, and eutectoid and eutectic points appear.
Alpha ferrite is the stable phase at room temperature and up to approximately 912 °C. It has a body-centred cubic (BCC) crystal structure, low carbon solubility (maximum 0.02% at 723 °C), and good ductility. Delta ferrite, stable at high temperatures (1,394–1,538 °C), also has a BCC structure.
Austenite is the stable solid phase between 912 °C and 1,495 °C. It has a face-centred cubic (FCC) structure, which allows much greater carbon solubility than ferrite: up to 2.14% C at 1,148 °C. Austenite is the starting phase for most steel heat treatments.
Cementite is iron carbide with the formula Fe₃C, containing 6.67% C by weight. It is an extremely hard and brittle phase with an orthorhombic structure. It is often found in lamellar form in pearlite or as an intergranular network in hypereutectoid cast irons.
Pearlite is not a single phase, but a lamellar microstructure composed of alternating layers of ferrite and cementite. It forms during slow cooling of austenite at the eutectoid point (0.8% C, 723 °C) through the eutectoid reaction.
Ledeburite is the eutectic microstructure of cast irons, composed of austenite and cementite. It forms at 1,148 °C with a carbon content of 4.3%. It is characteristic of white cast irons and is responsible for their high hardness and brittleness.
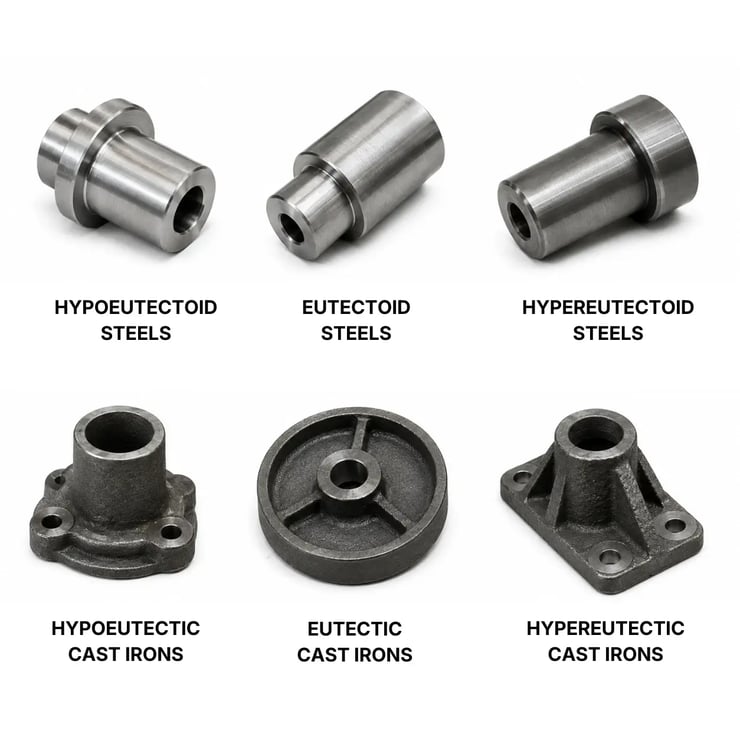
The diagram divides iron-carbon alloys into two main categories.
Carbon content up to approximately 2.06% They are:
Carbon content above 2.06% They are:
|
Type |
Carbon content |
Main characteristics |
|
Hypoeutectoid steels |
0,02-0,8% |
Ferrite + perlite; good ductility |
|
Eutectoid steels |
~0,8% |
Perlite; balance between hardness and ductility |
|
Hypereutectoid steels |
0,8-2,14% |
Perlite + cementite; high hardness |
|
Hypoeutectic cast irons |
2,14-4,3% |
Perlite + transformed ledeburite |
|
Eutectic cast irons |
4,3% |
Pure ledeburite |
|
Hypereutectic cast irons |
4,3-6,67% |
Ledeburite + primary cementite |
One of the most important points of the diagram is the eutectoid point:
Here, austenite transforms completely into pearlite. It is the basic reference for many heat treatments.
The eutectic point is located at:
Here, the liquid solidifies directly into:
It is fundamental in the study of cast irons.
The peritectic point is located at approximately:
At this point, the liquid and delta ferrite react to form austenite.
To read the diagram, one must:
From this you can tell what phases are present, how the mechanical properties will vary, and how the material will react to heat treatments.
The diagram is used for:
Understanding the Fe-C diagram is indispensable for designing and controlling the main heat treatments of steels.
Slow cooling that brings the microstructure towards equilibrium, reducing residual stresses and increasing ductility.
Cooling in air from austenite; produces finer microstructures than annealing.
Rapid cooling that prevents carbon diffusion, transforming austenite into martensite, a very hard metastable phase.
Treatment following quenching that reduces brittleness and relieves internal stresses, slightly increasing ductility.
Surface carbon enrichment process to bring a surface layer into the compositional range that favours martensite formation during quenching.
The diagram:
For special steels, more complex diagrams are used: TTT, CCT, or multicomponent diagrams.
The iron-carbon diagram is the foundation of the metallurgy of steels and cast irons. It allows an understanding of microstructural transformations, mechanical behaviour, and the effects of heat treatments.
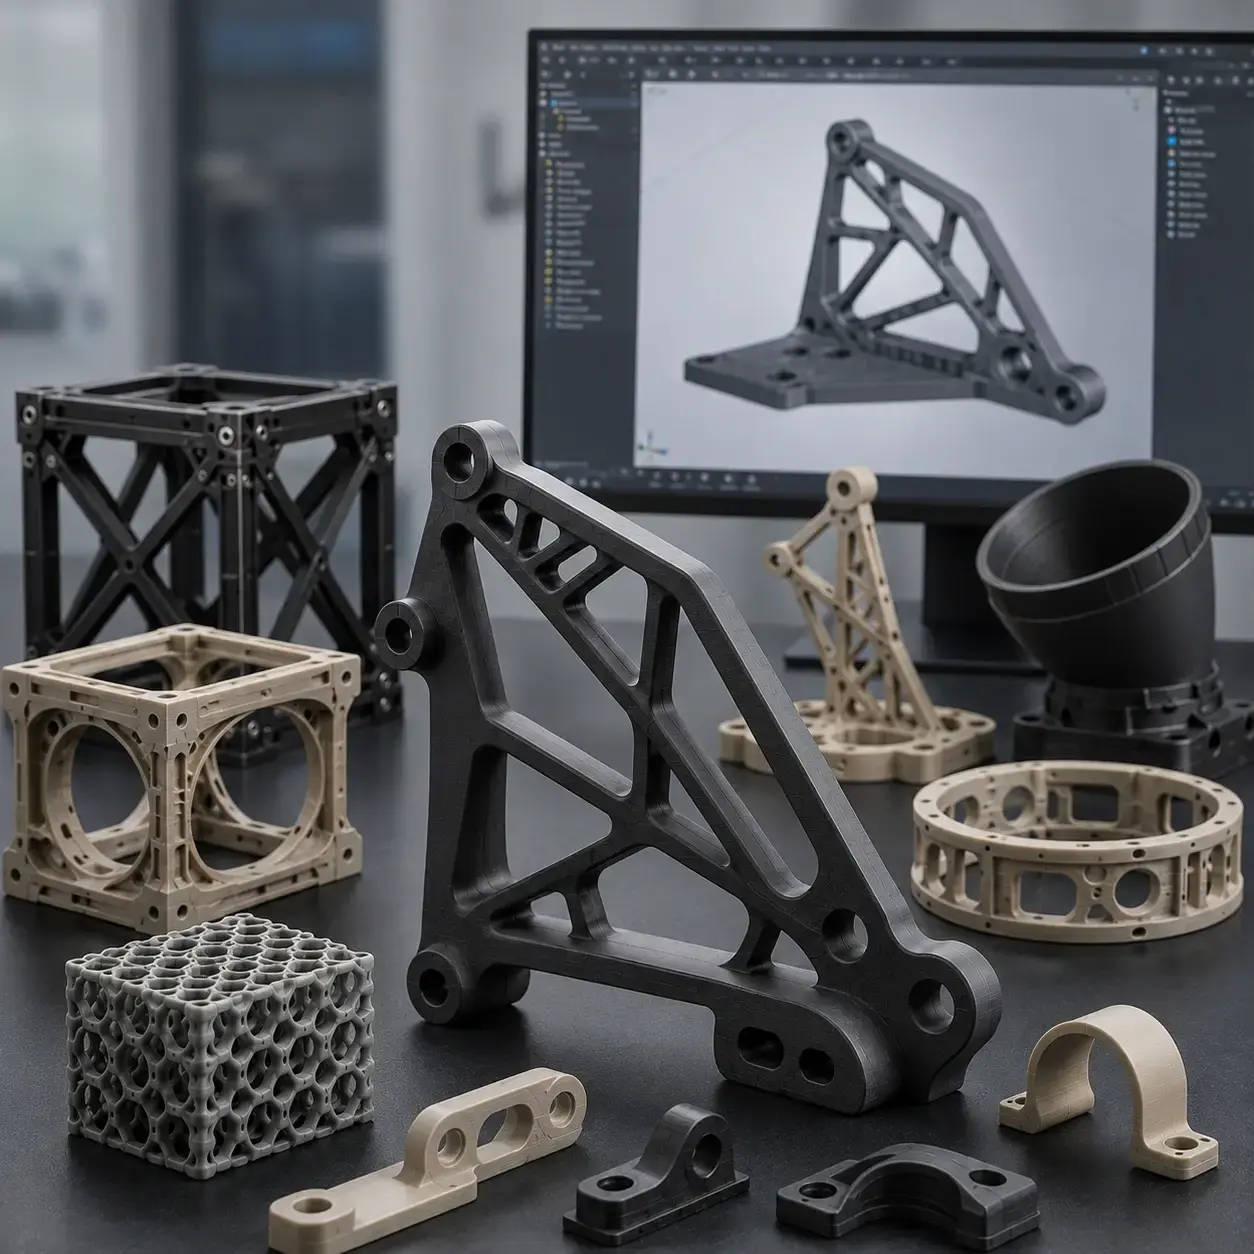
Whether working in design, CNC production, heat treatments, or additive manufacturing, understanding the iron-carbon diagram means understanding the behaviour of metallic materials at the heart of modern industry.
Would you like to choose the most suitable metallic material for your project?
Upload your file and explore the available materials
In the iron-carbon diagram, steels have a carbon content of up to approximately 2.06–2.14%, whilst cast irons exceed this value. Steels are generally more ductile, machinable, and weldable, whilst cast irons are harder, more brittle, and better suited to casting and founding.
The iron-carbon diagram helps to understand which microstructural transformations occur during heating and cooling. For this reason, it is essential for controlling heat treatments such as quenching, tempering, annealing, normalising, and carburising, influencing the hardness, strength, ductility, and toughness of the material.
8 min read
Choosing the most suitable material for an aerospace component is one of the most delicate design decisions. Every gram affects fuel consumption,...
6 min read
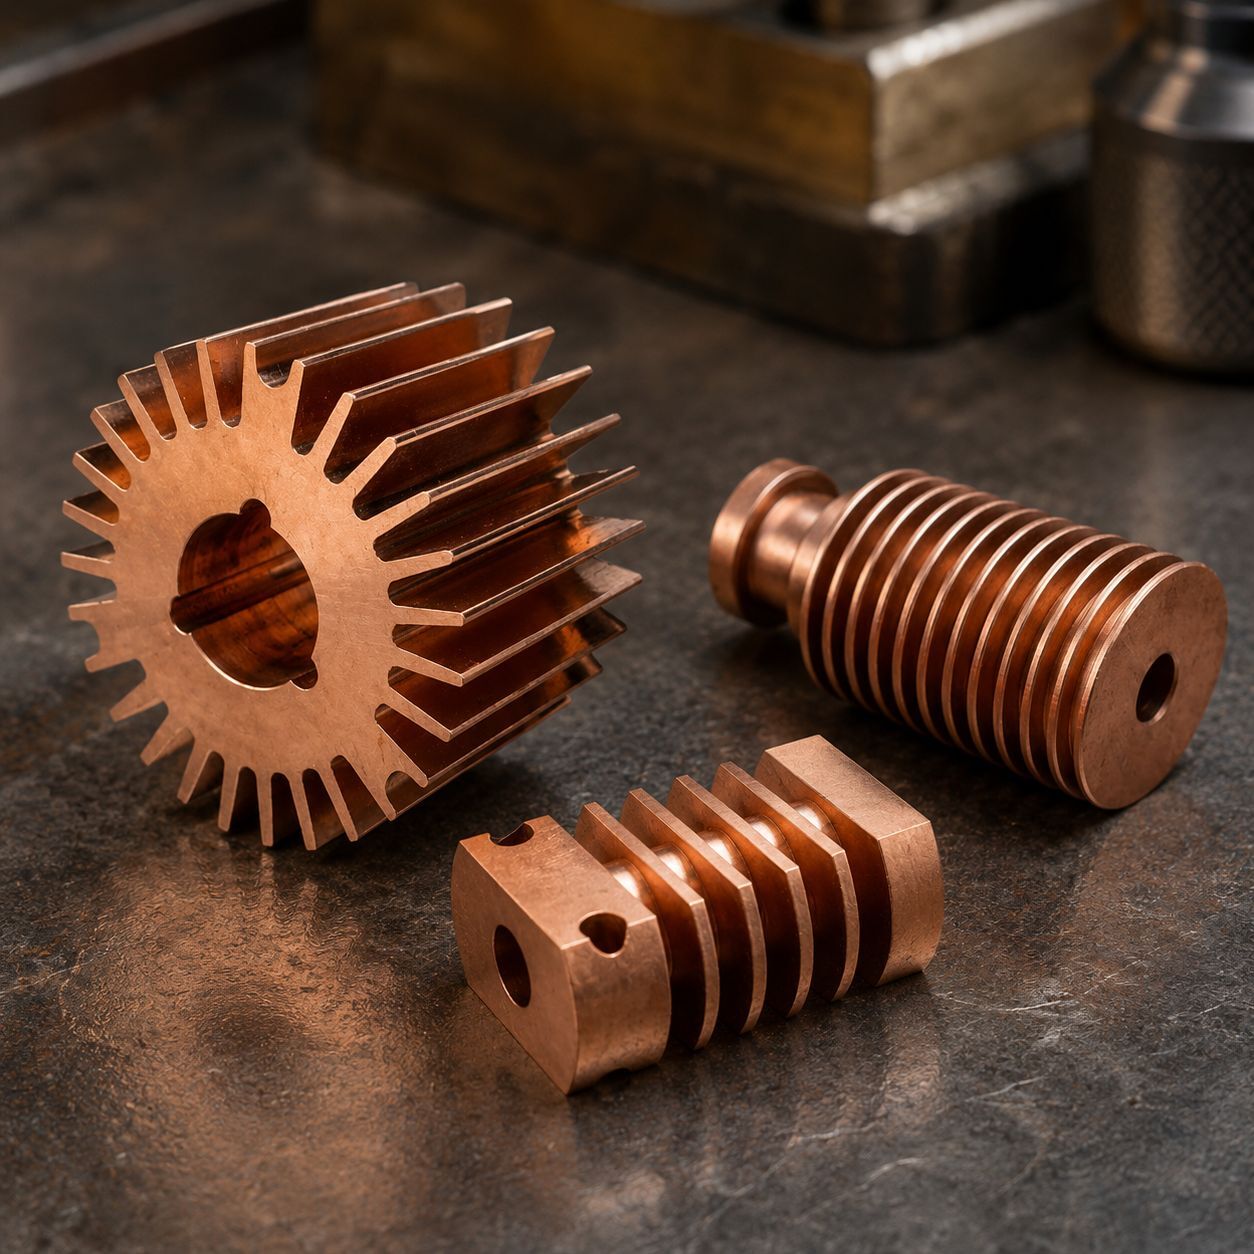
Copper alloys are one of the most versatile groups of materials available to designers: they combine copper’s conductivity and corrosion resistance...
4 min read
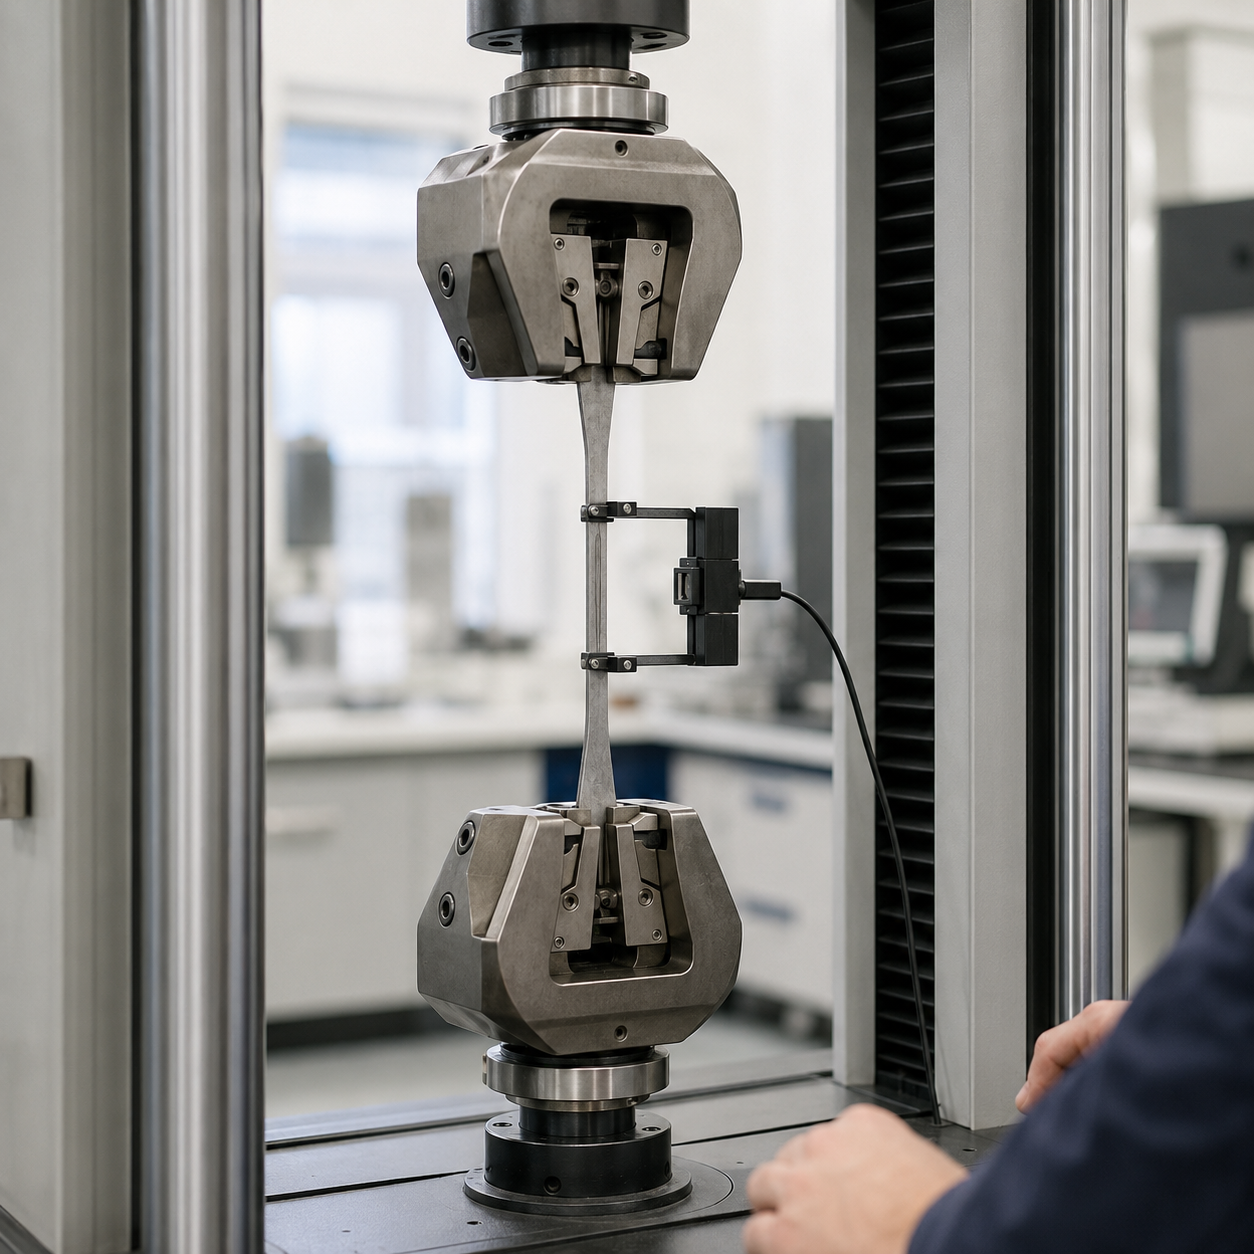
The tensile test is the most widely used mechanical test in the world for characterising materials. A single test provides the data that every...